Your Shopping Cart

Enroll now to become a Data Analytics expert with EDTIA Data Analytics with R Certification Certification Training, upgrade your skills, and lead your professional life.
Data Analytics with R activity will help you gain knowledge in R Programming, Data Manipulation, Exploratory Data Analysis, Data Visualization, Data Mining, Regression, Sentiment Analysis, and using R Studio for real-life case studies on Retail, Social Media.
R analytics is data analytics using R programming language, an open-source language utilized for statistical computing or graphics. This programming language is usually used in statistical analysis and data mining, and it can be operated for analytics to identify patterns and build practical models.
R analytics is data analytics utilizing R programming language, an open-source language operated for statistical computing or graphics. This programming language is often used in statistical analysis and data mining, and it can be used for analytics to identify patterns and build practical models.
Data analysis can help companies comprehend their customers, evaluate their ad campaigns, personalize content, develop content strategies and develop products. Ultimately, businesses can utilize data analytics to boost performance and enhance their bottom line.
R for data science is used in banking, telecommunications and media.
R analytics is data analytics using R programming language, an open-source language operated for statistical computing or graphics. This programming language is often used in statistical analysis and data mining, and it can be used for analytics to identify patterns and build practical models.
R allows us to do different machine learning operations such as classification and RegressionRegression. For this purpose, R provides multiple packages and features for developing the artificial neural network, and R is used by the best data scientists in the world.
Data Analysis with R Programming is a comprehensive course that provides a good insight into the latest and advanced features open in different formats. It describes how to perform different data analysis functions using R Programming.
Learn keywords in R like Business Intelligence, Business Analytics, Data and Information, how R can play an essential role in solving complex analytical problems, what R is and how it is operated by the giants like Google, Facebook, Bank of America, etc. Also, the use of 'R' in the industry
Learn the basics of R programming, like data types and functions. This module presents a scenario and lets you think about the options to resolve it, such as which datatype should store the variable or which R function can help you in this scenario and how to apply the 'join' function in SQL.
learn a sample of a dirty data set and complete Data Cleaning on it, resulting in a data set ready for any analysis. Thus utilizing and analyzing the popular functions required to clean data in R.
comprehend the versatility and robustness of R, which can take up data in different formats, from a csv file to the data scraped. This module teaches you different data importing techniques in R.
learn that exploratory data analysis is an essential step in the analysis. EDA is for seeing what the data can point us past the formal modeling or hypothesis.
learn that visualization is the USP of R, the concept of creating complex and straightforward visualizations in R.
know about the various Machine Learning algorithms, discuss the process involved in 'K-means Clustering' and the various statistical measures you need to know to implement it in this module.
8. Data Mining: Association Rule Mining & Collaborative filtering know how to find the associations between many variables utilizing the popular data mining technique called the "Association Rule Mining" and execute it to predict buyers' next purchase.
Learn base of 'Regression Techniques'. Linear and logistic RegressionRegression is explained from the basics with the examples, and it is implemented in R using two case studies dedicated to each type of RegressionRegression discussed.
Learn about the Analysis of Variance (Anova) Technique. The algorithm and different elements of Anova have been consulted.
Learn the ideas of Decision Trees and Random Forest. Random Forests algorithm is discussed step-wise and explained with real-life examples. These concepts are implemented on a real-life data set at the end of the class.
Know various concepts taught throughout the course and their implementation in a project.
Edtia Support Team is for a lifetime and will be open 24/7 to help with your questions during and after completing the Data Analytics with R Certification Training.
The good news is that Academics and scientists have developed r. It is prepared to answer statistical problems, machine learning, and data science. R is the right tool for data science because of its strong communication libraries.
To better understand the Data Analytics with R Certification Training, one must learn as per the curriculum.
Data analytics is an outstanding career, and there has never been a more suitable time to be a data professional. About 2.5 quintillion bytes of data are completed every day—and that pace is only quickening.
If you are starting your career as a data analyst at the entry level, you can expect around US$66,994.
Various big tech companies like Facebook, Google, Uber, etc., use the R language for their businesses. Considering the rapidly increasing demand for data science and machine learning trends, learning the R programming language is undoubtedly worthwhile for your future career endeavours.


Every certification training session is followed by a quiz to assess your course learning.

The Mock Tests Are Arranged To Help You Prepare For The Certification Examination.

A lifetime access to LMS is provided where presentations, quizzes, installation guides & class recordings are available.

A 24x7 online support team is available to resolve all your technical queries, through a ticket-based tracking system.

For our learners, we have a community forum that further facilitates learning through peer interaction and knowledge sharing.

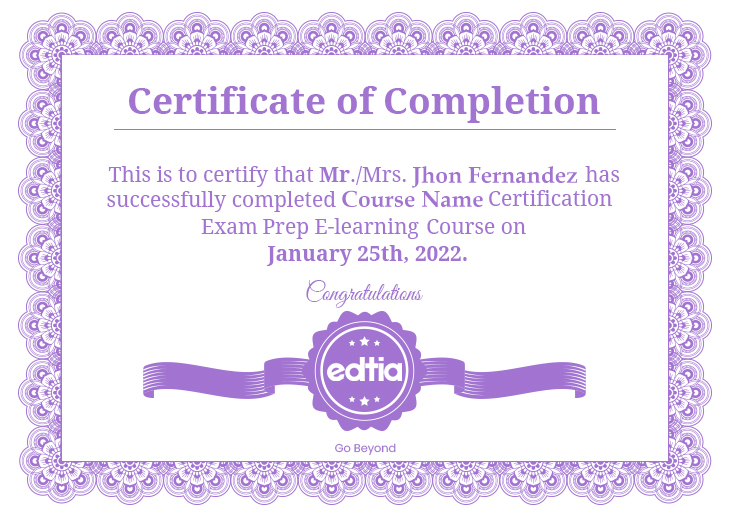
Successfully complete your final course project and Edtia will provide you with a completion certification.
Data Analytics with R Training demonstrates that the holder has the proficiency and aptitudes to work with Data Analytics with R.
How do I get my Edtia Data Analytics with an R Training certificate?
Data Analytics with R training will enable you to gain expertise in R Programming, Data Manipulation, Exploratory Data Analysis, Data Visualization, Data Mining, Regression, Sentiment Analysis, and using R Studio for real-life case studies on Retail, Social Media.
Yes, it is worth learning as it is developing technology, and there is a massive necessity for Data Analysts and Data Scientists in the current mechanical world.
